Current research activities generate multiple types of data. For instance, continuing tri-annual cruises measure oceanographic conditions along established transect lines in specific seasons. Additionally, process studies and experiments investigate ecological processes in the Gulf of Alaska and within discrete areas such as the plume of the Copper River. Finally, modeling studies use these data to constrain parameters and validate results.
Are you looking for archived data?
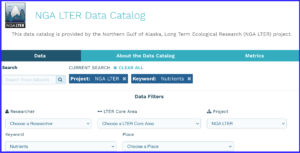
Screenshot of our Data Catalog
Archived NGA LTER data is hosted by our partner Axiom Data Science. Consequently, it is accessible via a data catalog that is part of the DataONE cyberinfrastructure.
The data catalog searches according to the contents of the datasets’ metadata. However, the actual contents of the data files are not searched. Therefore, a user can search by keyword or Principal Investigator (PI), but not by station or cruise.
What is returned by the search?
As with other data archives, datasets are grouped by instrument/parameter type and research team. Those groups are given citations. Then the citations are returned by searches.
So searching the data catalog returns a list of dataset citations with their Digital Object Identifiers (DOI). Once you find an interesting dataset, the citation link takes you to a page with more information. Then that page provides links to downloadable data and metadata files.
How are data files organized?
As oceanographic data, NGA’s samples are very diverse. That diversity is reflected in the files in our archive.
For the most part, NGA LTER data files are comma-delimited CSV, and metadata are in ISO format (though older files may have different formats). Individual cruises or years are often in separate files. Pay careful attention to the metadata to learn specifics about each dataset.
Data files have a variety of spatial structures. For instance, sampling at oceanographic stations will produce measurements integrated in depth ranges (biological nets), at 1 dbar intervals (CTD profiles), or at discrete depths (water samples from the CTD rosette’s bottle). Or underway sampling can produce data in locations that vary in time (TSG), discrete observations along transects (seabirds), or sections with depth (Acrobat).
Are you looking for Signature Datasets?
Because the diversity of NGA LTER datasets may make them difficult to use in scientific synthesis efforts, we also provide our data in simpler formats. As they are produced, they will be our Signature Datasets.
Signature Datasets are available for:
Seward Line Zooplankton Biomass (Population Studies)
Seward Line Physical Hydrography (Disturbance Patterns)
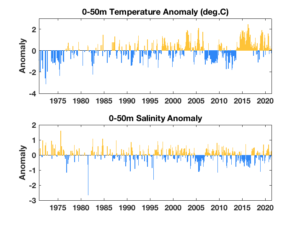
GAK1 Temperature and Salinity Time Series (Disturbance Patterns)
Seward Line Nutrients (Movement of Inorganic Matter)
Integrated Chlorophyll (Primary Production)
If you are interested in a time series of data that you do not see in the list, please let us know.
Other Collections of Recent Data
Data from R/V Sikuliaq Instruments
We are fortunate that R/V Sikuliaq is the platform for many of our research cruises. As a UNOLS vessel, R/V Sikuliaq’s instrumentation provides data directly to the Rolling Deck to Repository (R2R).
Hopcroft, Russell (2023): KM2308: Environmental sensor data acquired during the R/V Kilo Moana cruise, 26 June - 16 July 2023, R2R Rolling Deck to Repository, 2023, https://doi.org/10.7284/910407.
Hopcroft, Russell (2023): SKQ202307S: Environmental sensor data acquired during the R/V Sikuliaq cruise, 22 April - 9 May 2023, R2R Rolling Deck to Repository, 2023, https://doi.org/10.7284/910124.
Hopcroft, Russel (2022): SKQ202210S: Environmental sensor data acquired during the R/V Sikuliaq cruise, 7 - 27 July 2022, R2R Rolling Deck to Repository, 2022, https://doi.org/10.7284/909594.
Hopcroft, Russell (2022): SKQ202207S: Environmental sensor data acquired during the R/V Sikuliaq cruise, 21 April - 7 May 2022, R2R Rolling Deck to Repository, 2022, https://doi.org/10.7284/909561.
Hopcroft, Russell (2021): SKQ202110S: Environmental sensor data acquired during the R/V Sikuliaq cruise, 27 June - 12 July 2021, R2R Rolling Deck to Repository, 2021, https://doi.org/10.7284/909176.
Hopcroft, Russell (2021): SKQ202106S: Environmental sensor data acquired during the R/V Sikuliaq cruise, 23 April - 6 May 2021, R2R Rolling Deck to Repository, 2021, https://doi.org/10.7284/909109.
Hopcroft, Russell (2020): SKQ202012S: Environmental sensor data acquired during the R/V Sikuliaq cruise, 1-9 September 2020, R2R Rolling Deck to Repository, 2020, https://doi.org/10.7284/908920.
Hopcroft, Russell (2020): SKQ202006S: Environmental sensor data acquired during the R/V Sikuliaq cruise, 4-11 May 2020, R2R Rolling Deck to Repository, 2020, https://doi.org/10.7284/908917.
Hopcroft, Russell (2020): SKQ202010S: Environmental sensor data acquired during the R/V Sikuliaq cruise, 2-16 July 2020, R2R Rolling Deck to Repository, 2020, https://doi.org/10.7284/908919.
Danielson, Seth (2019): SKQ201915S: Environmental sensor data acquired during the R/V Sikuliaq cruise, 29 June - 18 July 2019, R2R Rolling Deck to Repository, 2019, https://doi.org/10.7284/908324.
Hopcroft, Russell (2018): SKQ201810S: Environmental sensor data acquired during the R/V Sikuliaq cruise, 4 April - 5 May 2018, R2R Rolling Deck to Repository, 2018, https://doi.org/10.7284/907945.
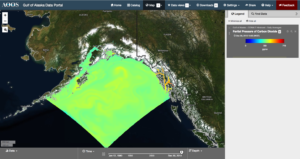
Interactive Model Results
Several modeling efforts are underway in connection with NGA LTER. The model results can be explored via a web browser in the Alaska Ocean Observing System’s (AOOS‘s) Gulf of Alaska portal. These models are currently available:
This dataset was produced by a coupled physical-biogeochemical model for the northern coastal Gulf of Alaska as part of the NGA LTER Program funded by NSF. The physical model component solves for temperature, salinity, ocean currents, and sea surface height. The biogeochemical component includes 4 limiting nutrients, 2 phytoplankton functional groups and 6 zooplankton functional groups. The outputs presented are all monthly means, 1994-2017.
Gulf of Alaska COBALT hindcast (Hauri et al., 2020)
Gulf of Alaska COBALT hindcast model in AOOS’s Gulf of Alaska portal
This model was run for 1980-2013 and includes 100 oceanographic variables, including those important to ocean acidification and climate change. Currently, the GoA-COBALT model is being used to investigate how large scale oscillations like the North Pacific Gyre Oscillation can modulate ocean acidification.
Historical Context
Types of Data Available
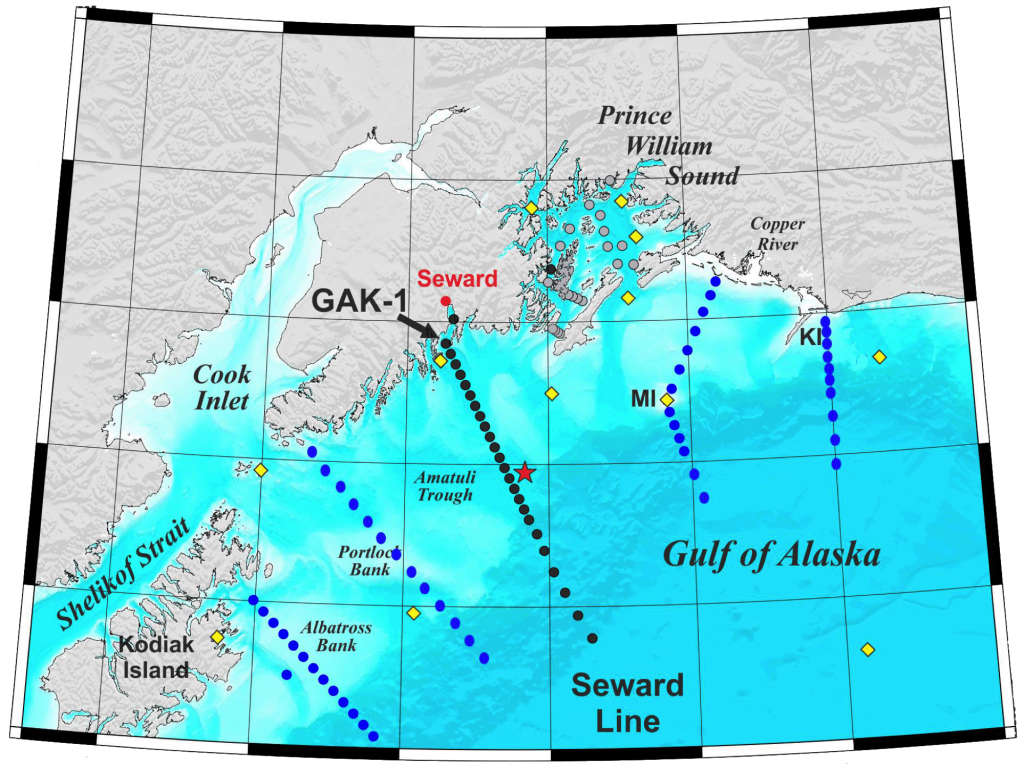
The U.S. GLOBEC Northeast Pacific (NEP CGOA) program focused on salmon and their environment (1997-2004). Those efforts sampled along the Seward Line and other transects. In addition to salmon haul data, GLOBEC datasets include zooplankton counts, CTD station data, and results from phytoplankton growth rate and microzooplankton grazing experiments.
Map of Northern Gulf of Alaska sampling stations
Between the GLOBEC years and the current LTER program, various projects continued collecting Seward Line data (2005-2017). These datasets include physical properties, nutrients, and chlorophyll collected along the Seward Line for monitoring purposes. NPRB’s Project Search & Database and Gulf Watch’s Environmental Drivers Overview provide information on individual projects, including some final reports.
Additionally, annually deployed moorings and month CTD sampling provide long time series at the station GAK1. Recently, moorings have also been deployed at the GEO mooring location near GAK4.
Additional Archives
While we are working to consolidate these decades of data under the umbrella of NGA LTER, other archives provide data from these historic projects as well. If you prefer to visit the original archives, refer to these links:
Our data catalog includes GLOBEC NEP data as they were archived in NCEI. The Biological and Chemical Oceanography Data Management Office (BCO-DMO) hosts the original archive. We maintain a table of links to that archive for data from 1997-2004.
The GAK1 research website includes plots of CTD and mooring time series (although the data is best accessed via the data catalog).
Alaska Ocean Observing System’s (AOOS’s) Gulf of Alaska data portal includes some years of Seward Line CTD data.